
South Suburbs for Greenspace over Concrete is organizing a demonstration at the Homewood Planning and Zoning Commission meeting this week, where the body will take the next step in a settlement agreement with the buyer of Calumet Country Club. The agenda for the 7 p.m. meeting Thursday at village hall,[Read More…]
Tag: News
COVID-19 numbers: Feb. 8
This graph shows the state’s progress in receiving and administering COVID-19 vaccines. The scale on the right is the measure of vaccine doses received. The scale on the left is the measure of doses administered and the seven-day rolling average of administered doses. Region 10 (includes H-F) Positve test rate: 4.8% ↓[Read More…]
Homewood trustees to consider contract for 183rd Street traffic study
Traffic safety on 183rd Street in Homewood has been a high priority for residents and village officials after a fatal accident last summer, and on Tuesday trustees will have an opportunity to take another step toward improving the situation. On the board’s agenda for its 7 p.m. meeting Tuesday, Feb.[Read More…]
COVID-19 numbers: Feb. 7
This graph shows the state’s progress in receiving and administering COVID-19 vaccines. The scale on the right is the measure of vaccine doses received. The scale on the left is the measure of doses administered and the seven-day rolling average of administered doses. Region 10 (includes H-F) Positve test rate: 4.9% ↓[Read More…]
Homewood Planning and Zoning Commission to consider request to rezone Calumet Country Club property
The Homewood Planning and Zoning Commission will meet at 7 p.m. Thursday to consider rezoning the former Calumet Country Club property to enable industrial use on the land, which has been a golf course since 1917. If approved, the rezoning request by W&E Ventures LLC would rezone the property at[Read More…]
Peregrine falcon topic of Feb. 11 Homewood Science Center talk
The Homewood Science Center is hosting a Feb. 11 program about the peregrine falcon. The 7 p.m. program is part of the science center’s Citizen Science Program on birds. The guest presenter will be Mary Hennen, director of the Chicago Peregrine Program, Gantz Family Collections Center, at the Field Museum. [Read More…]
COVID-19 numbers: Feb. 6
This graph shows the state’s progress in receiving and administering COVID-19 vaccines. The scale on the right is the measure of vaccine doses received. The scale on the left is the measure of doses administered and the seven-day rolling average of administered doses. Region 10 (includes H-F) Positve test rate: 5% ↓[Read More…]
Select property tax exemptions set to automatically renew
The Illinois legislature is allowing for the automatic renewal of many property tax exemptions for tax year 2020. Cook County Assessor Fritz Kaegi said the change is due to the COVID-19 pandemic. The exemptions will be applied to the second installment of the property tax bill that is issued in[Read More…]
COVID-19 numbers: Feb. 5
This graph shows the state’s progress in receiving and administering COVID-19 vaccines. The scale on the right is the measure of vaccine doses received. The scale on the left is the measure of doses administered and the seven-day rolling average of administered doses. Region 10 (includes H-F) Positve test rate: 5.3% ↓[Read More…]
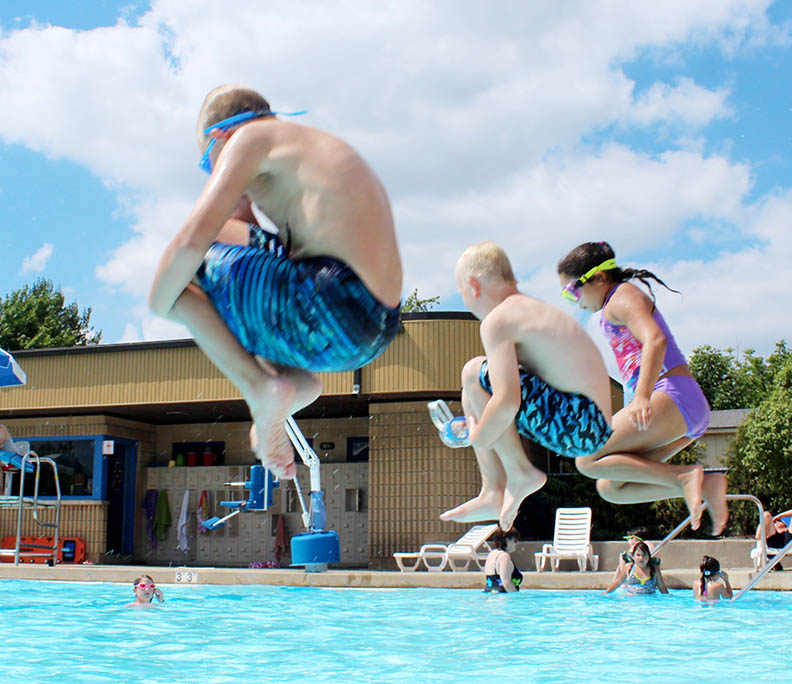
Park district dives into debate over opening Lions Pool
Newsletter
