
This graph shows the state’s progress in receiving and administering COVID-19 vaccines. The scale on the right is the measure of vaccine doses received. The scale on the left is the measure of doses administered and the seven-day rolling average of administered doses. Region 10 (includes H-F) Positve test rate: 3.4%[Read More…]
Tag: COVID-19
COVID-19 numbers: March 14
This graph shows the state’s progress in receiving and administering COVID-19 vaccines. The scale on the right is the measure of vaccine doses received. The scale on the left is the measure of doses administered and the seven-day rolling average of administered doses. Region 10 (includes H-F) Positve test rate: 3.2%[Read More…]
COVID-19 numbers: March 13
This graph shows the state’s progress in receiving and administering COVID-19 vaccines. The scale on the right is the measure of vaccine doses received. The scale on the left is the measure of doses administered and the seven-day rolling average of administered doses. Region 10 (includes H-F) Positve test rate: 3.2%[Read More…]
COVID-19 numbers: March 12
This graph shows the state’s progress in receiving and administering COVID-19 vaccines. The scale on the right is the measure of vaccine doses received. The scale on the left is the measure of doses administered and the seven-day rolling average of administered doses. Region 10 (includes H-F) Positve test rate: 3.2%[Read More…]
COVID-19 numbers: March 11
This graph shows the state’s progress in receiving and administering COVID-19 vaccines. The scale on the right is the measure of vaccine doses received. The scale on the left is the measure of doses administered and the seven-day rolling average of administered doses. Region 10 (includes H-F) Positve test rate: 3.2%[Read More…]

Staying well together: Improve your chances with timely cancer screenings
When the COVID-19 pandemic arrived in the South Suburbs last March, most people quickly learned that staying home was a good way to reduce the odds of contracting COVID-19. Local health care professionals advocate one important caveat: Don’t stay home so much that you neglect other important health care measures,[Read More…]
COVID-19 numbers: March 10
This graph shows the state’s progress in receiving and administering COVID-19 vaccines. The scale on the right is the measure of vaccine doses received. The scale on the left is the measure of doses administered and the seven-day rolling average of administered doses. Region 10 (includes H-F) Positve test rate: 3.2%[Read More…]
COVID-19 numbers: March 8
This graph shows the state’s progress in receiving and administering COVID-19 vaccines. The scale on the right is the measure of vaccine doses received. The scale on the left is the measure of doses administered and the seven-day rolling average of administered doses. Region 10 (includes H-F) Positve test rate: 3.2%[Read More…]
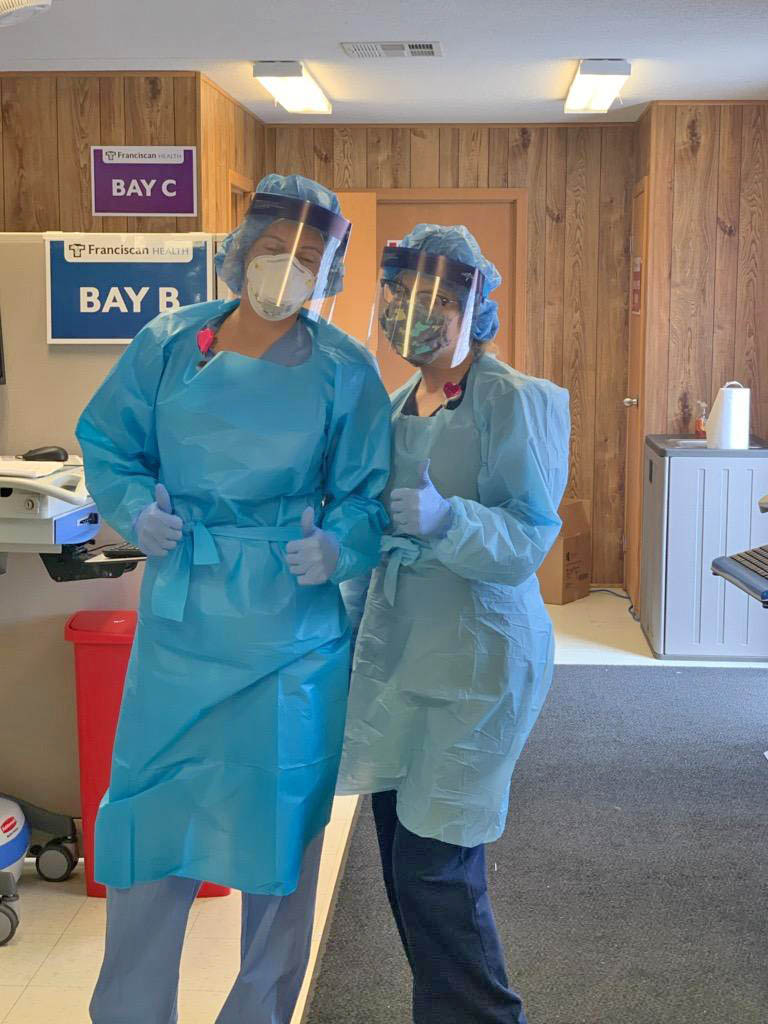
Staying well together: During the time of COVID-19, health care workers give their all
Health care workers at Franciscan Health in Olympia Fields encourage people to stay home to help curb the spread of COVID-19. (Photo courtesy of Franciscan Health Olympia Fields) Editor’s note: This is the second in a series of stories first published in the Chronicle’s annual Health and Wellness special section[Read More…]
COVID-19 numbers: March 7
This graph shows the state’s progress in receiving and administering COVID-19 vaccines. The scale on the right is the measure of vaccine doses received. The scale on the left is the measure of doses administered and the seven-day rolling average of administered doses. Region 10 (includes H-F) Positve test rate: 3.3%[Read More…]
Newsletter
