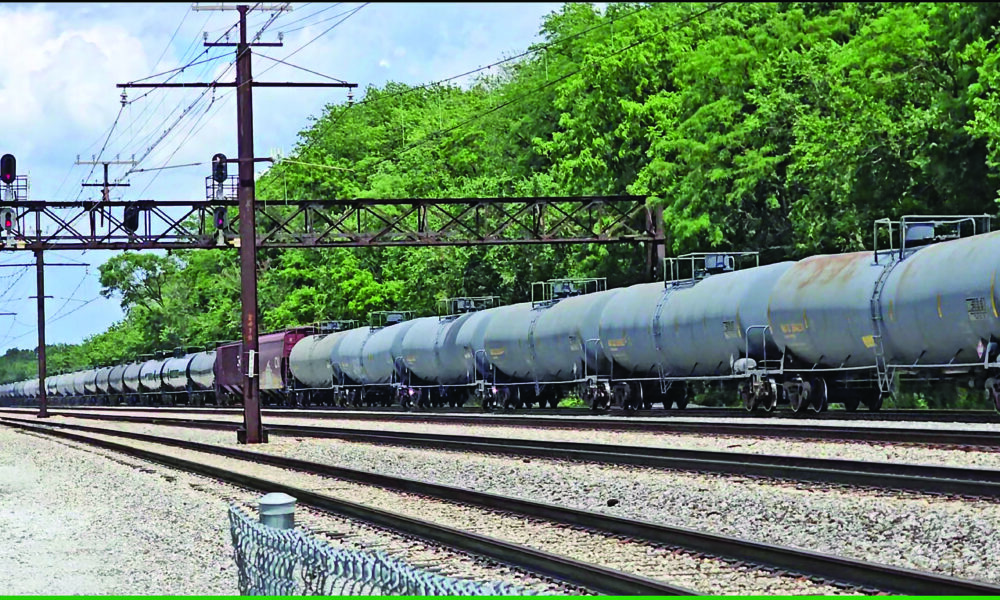
Homewood and Flossmoor were founded along existing rail lines, so train traffic has been routine for the entire history of both villages.
It’s easy to take for granted the presence of train cars but not as easy to discover what kinds of materials are in them.
Information on specific quantities of specific materials is proprietary information that railroads do not divulge to the public.
“When it comes to the goods we ship, sharing that information is considered security sensitive and is not widely shared in order to keep communities safe,” said Michelle Hannan, CN media relations advisor.
We can get a rough idea of what local rail cars contain, though. The Chicago Metropolitan Agency for Planning has a draft report on a study, “The Freight Landscape” that includes data on freight shipped by rail that starts from, terminates at or passes through the Chicago region rail system.
Tom Murtha, CMAP senior planner, said the report will provide an overview of the whole freight system, including rail, truck, marine, pipeline and air services.
“The railroads report information to the Surface Transportation Board and the Surface Transportation Board then anonymizes the data,” Murtha said. “We are not given information about individual yards (or) individual railroads.”
The Chicago rail network is the biggest intermodal hub in the nation, and more than 85% of cars originating in Chicago haul containers or trailers that will connect with trucking routes at some point.
After containers and trailers, the top car types by units are hoppers, 7.2%; gondolas, 2.5%; tank cars, 2.4%; other flatcars, 1.7%; and boxcars, 0.3%.
When it comes to quantities of materials by weight, miscellaneous mixed shipments make up the biggest portion of inbound and outbound rail freight, with 36% and 27% respectively.
Chemicals and allied products make up the largest portion of materials passing through the region at 31.5%.
Chemicals and coal are also significant inbound materials at 13% and 10.4% respectively.
Other major outbound materials include farm products, 13.2%; non-metallic minerals, 12%; and metal products, 10.3%.


