H-F school board formally terminates Pitcock contract
More in Local News:
- 4.18.2024 | What You Need To Know Today April 18, 2024
-
 Thornton Township residents approve financial reports, ask for better access to information
April 17, 2024
Thornton Township residents approve financial reports, ask for better access to information
April 17, 2024
- 4.17.2024 | What You Need To Know Today April 17, 2024
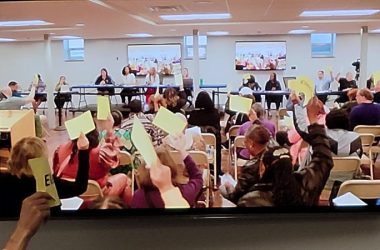
The Homewood-Flossmoor High School school board officially terminated the contract of former principal Ryan Pitcock, despite pleas for his return.The 6-1 vote was described as confirmation of “the termination of the principal, Ryan Pitcock, by exer